Table of Contents
- 1. Debugger Overview
- 2. Using the OpenLaszlo Debugger Console
- 3. Runtime Error Checking
-
- 3.1. Getting Version Information
- 3.2. Inspecting Objects
- 3.3. Logging to the Debugger
- 3.4. Generating a Bug Report
- 3.5. Formatting Output
- 3.6. Customizing
Debug.write() - 3.7. Debug Message Level
- 3.8. Explaining CSS with
Debug.explainStyleBindings(node) - 3.9. Conditional Compilation of Debugging Code
- 3.10. Logging to the Server
- 4. Finding memory leaks
- 5. Debugging in DHTML
Openlaszlo provides a powerful debugger which you can use either embedded in the application or as a separate ("remote") process. In addition, when you are compiling applications for deployment to DHTML, you may benefit from using tools for debugging in that environment.
There are two ways to use the debugger:
-
Interactively, using the Debugger Console (see Section 2, “Using the OpenLaszlo Debugger Console”)
-
At runtime, using
Debug(see Section 3, “Runtime Error Checking”)
This chapter describes both of these methods. In addition, this chapter describes how you find memory leaks (see Section 4, “Finding memory leaks”), and provides additional tips for debugging in DHTML (see Section 5, “Debugging in DHTML”).
When you run an application with debugging enabled, the Debugger Console appears within the application canvas. The debugger provides these features:
-
The top portion of the Debugger Console displays a scrolling list of debug messages. These include runtime debugger messages (Section 3, “Runtime Error Checking”) as well as the result of Javascript expressions you enter into the command line.
-
The command-line portion of the Debugger Console can be used to evaluate JavaScript statements and expressions within the context of the running application. Use this to inspect the program state, to test the behavior of functions and methods on various arguments, and to explore the LZX API.
-
Warnings for runtime errors such as undefined variables and functions are detected, and printed to the Debugger Console.
![[Note]](images/note.png) |
Note |
|---|---|
|
Debugging may cause the application to run more slowly, even if the Debugger Console is not visible. |
There are three ways to turn on the Debugger Console in your application:
The Debugger Console is enabled if the canvas debug attribute is
set to true:
Example 51.1. The canvas debug attribute
<canvas width="100%" height="125" debug="true">
  <debug y="5"/>
</canvas>
<!-- * X_LZ_COPYRIGHT_BEGIN ***************************************************
* Copyright 2008 Laszlo Systems, Inc.  All Rights Reserved.                   *
* Use is subject to license terms.                                            *
* X_LZ_COPYRIGHT_END ****************************************************** -->

Check the Debug checkbox on the Developer
Toolbar (see Section 2.5, “The Developer Toolbar”) to request a copy of the
application with the Debugger Console enabled. This is equivalent to recompiling the
application with the canvas attribute debug="true".
Edit the URL that is used to request the application to include the
debug=true query parameter. This is equivalent to checking the
Debug checkbox in the Developer Toolbar.
See the OpenLaszlo System Administrator's Guide for more information about request types.
Use the <debug> tag to control the appearance of the
Debugger Console. See the reference page for
<debug> for a complete description.
By default, the debugger will occupy the bottom half of your application's
<canvas>. You can change the basic properties of the debugger by including
the debug tag in your application, like this:
<debug x="100" y="100" height="500"/>
Note that this does not enable the debugger; it merely
configures its appearance when the debugger is enabled. You still have use one of the
methods in Section 2.1, “Enabling the Debugger Console” to enable debugging. The effect of this
is that you can leave the <debug> tag in your program at
all times (including in production code), and it will only have an effect when debugging
is enabled.
The bottom portion of the Debugger Console is the evaluator. This is
a command-line interface for evaluating JavaScript expressions and statements within the
application. Enter a JavaScript statement into this area and press the Enter key (in
single-line mode) or the Evaluate button (in multi-line mode) to evaluate the statement
within the application. If the statement is an expression, its result (if the result is not
undefined) is printed to the debugger log. If it is a statement but not
an expression, it is executed for effect.
Examples of expressions are canvas.x, 1+2, and
lz.Browser.loadURL('http://www.laszlosystems.com/', '_blank'). (The
last expression returns the value undefined, so the debugger does not
print the expression value in the debugger log.) An example of a non-expression statements
is for (var i = 0; i < 10; i++) Debug.debug("%d", i). This is
evaluated for effect, and the statement itself does not result in a value, although each
execution of the loop prints the value of i to the debugger log.
The debugger can not define new global bindings in some runtimes. (It can usually re-define existing global bindings, but even that may be prevented in some runtimes.) In general, the Debugger evaluator is meant for evaluating expressions that will help to introspect your program when you are debugging. It is not a general evaluator: it is limited by the underlying runtime.
Within a debugger expression, _ refers to the value of the previous
expression. For example, after evaluating canvas.width to display the
width of the canvas, you can evaluate the expression _/2 to display
half this width.
The debugger defines the following variables:
-
_ -
The result of the previous expression with a non-undefined value.
__[two underscore characters])-
The result of the expression prior to the previous expression.
___[three underscore characters]-
The result of the expression prior to the
__expression.
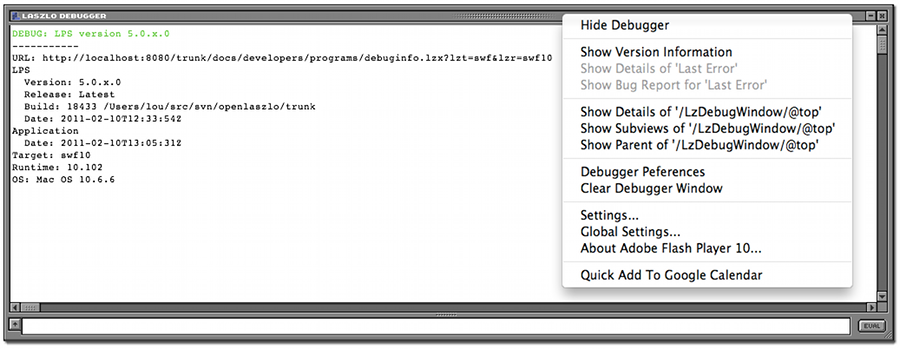
When you right-click on a view, you get a menu of things you can show about that view,
such as Show Details of (that is, inspect), Show Parent
of, Show Subviews of, and Show Style Bindings
of.
The Developer Toolbar provides additional instrumentation that you can use for debugging your code. Using the Developer Toolbar, you can specify:
-
Compiler Options: specifies the target runtime. -
Deploy: the target deployment mode. Click on one of these buttons for a description of that mode. -
Debugger checkboxes: specify debugger options, including whether or not to enable
DebugandBacktrace. -
Console Remote Debug: run the Debugger Console in a separate application in a window in the Developer Toolbar instead of in the application.
Runtime error checking using Debug can be useful in debugging your own
code, and for report bugs. See the reference page for <Debug> for a complete
description.
Enabling the debugger using one of the methods described in Section 2.1, “Enabling the Debugger Console” has two effects:
-
It includes the debugger visual component. This displays debug messages, and has a command line interface for evaluating JavaScript statements.
-
It compiles the application with additional instrumentation to perform runtime error checking. Certain classes of erroneous code (below) result in warnings that are logged to the Debugger Console.
A program that is compiled with runtime error checking will contain code that checks for the following conditions:
Table 51.1. Runtime error checks
| Condition | Example | Notes |
|---|---|---|
| Reference to undefined variable |
var w = canvs.width
|
canvs is not defined. (There is a global variable named
canvas, instead.)
|
| Reference to undefined property |
var w = canvas.widt
[a]
|
canvas does not have a widt property. (The
name of the property is canvas.width.)
|
| Call to undefined method |
lz.Browser.getVerson()
|
lz.Browser.getVerson (with no "i") is not defined.
|
| Call to undefined function |
var n = parseInteger("123")
|
parseInteger is not defined. (There is a JavaScript function
parseInt.)
|
| Call to non-function |
var w = canvas.width()
|
canvas.width is a Number, not a
Function.
|
|
[a] The debugger does not warn about undefined references if the subscript
notation is used: |
||
Each runtime exception warning is printed once per line per program run, not once each time the exception is encountered. The following program will print one warning, not ten.
Example 51.2. Runtime exceptions printed once per line
<canvas debug="true" height="150" width="100%">
  <debug y="10"/>
  <handler name="oninit"><![CDATA[
    for (var i = 0; i < 10; i ++) {
      canvas.width();
    }
  ]]></handler>
</canvas>
<!-- * X_LZ_COPYRIGHT_BEGIN ***************************************************
* Copyright 2008 Laszlo Systems, Inc.  All Rights Reserved.                   *
* Use is subject to license terms.                                            *
* X_LZ_COPYRIGHT_END ****************************************************** -->
Turning on runtime error checking makes an application bigger and slower. You should only perform size and speed optimization on the non-debug version of a program. Nonetheless, you will frequently want to run the debug warning to see whether you have introduced any runtime errors.
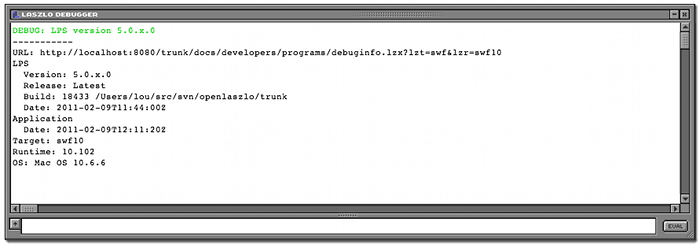
The simplest way to get LPS version information is to use
canvas.lpsversion. You can get more information, for example the build
number and target runtime, by using Debug.versionInfo(). The following
example shows both methods.
Example 51.3. Using Debug.versionInfo()
<canvas width="100%" height="325" debug="true">
    <debug x="5" y="5" height="300"/>
    <handler name="oninit">
        Debug.debug('LPS version %s', canvas.lpsversion)
        Debug.write("-----------")
        Debug.versionInfo()
    </handler>
</canvas>
<!-- * X_LZ_COPYRIGHT_BEGIN ***************************************************
* Copyright 2008 - 2011 Laszlo Systems, Inc.  All Rights Reserved.            *
* Use is subject to license terms.                                            *
* X_LZ_COPYRIGHT_END ****************************************************** -->
The previous two methods give you version information; to generate a full bug report, see Section 3.4, “Generating a Bug Report”.
Evaluating Debug.debug(, where object)
is an expression that evaluates to a JavaScript object, displays an
inspectable representation of the object in the debugger (not the
actual object). Long objects are abbreviated based on the value of
object
Debug.printLength (see Section 2.2, “Configuring the Debugger”).
Abbreviated objects are shown enclosed in double angle quotes, with an ellipsis indicating
abbreviation like this:
«object...»
If you inspect the abbreviated output, it will print the full object.
Clicking on an inspectable object displays its non-private properties and their values. Those values which are objects are also displayed as inspectable objects, so that they can be clicked on as well.
An object's private properties are those whose names begin with
$ or __ (two underscore characters). These names are
used by the compiler and by the OpenLaszlo Runtime Library implementation, respectively, and
are not part of the documented API for the object.
An inspectable object can be an OpenLaszlo Runtime Library object such as a window or
lz.dataset, or a built-in JavaScript object: for example, an array such
as [1, 2, 3], or an Object such as {a: 1, b:
2}.
The Debug.inspect() function also displays the object and its
properties. Evaluating Debug.inspect(object) is equivalent to evaluating
Debug.debug(object) and then clicking on the object's representation.
|
Note |
|---|---|
|
Because it's easy to confuse these two calling styles, it's almost always better to
use |
Example 51.4. Two ways of calling Debug.write
<canvas debug="true" height="250" width="100%">
  <debug y="10" height="200"/>
  <handler name="oninit">
    Debug.write('subviews: ' + canvas.subviews);
    Debug.write('subviews:',   canvas.subviews);
    Debug.debug('subviews: %#w',   canvas.subviews);
    Debug.debug('subviews: %w',   canvas.subviews);
  </handler>
</canvas>
<!-- * X_LZ_COPYRIGHT_BEGIN ***************************************************
* Copyright 2008 Laszlo Systems, Inc.  All Rights Reserved.                   *
* Use is subject to license terms.                                            *
* X_LZ_COPYRIGHT_END ****************************************************** -->
The top portion of the Debugger Console is the debugger log. Use
Debug.write() or Debug.format() (or one of its
variants) to print to the debugger log. These methods are variadic:
they take any number of arguments. The text representations of the arguments are printed to
the debugger log, separated by spaces.
Example 51.5. Logging to the debugger
<canvas debug="true" height="200" width="100%">
<debug x="160" y="5" height="150" width="300"/>
  <script>Debug.debug('user code');</script>
  <button text="Get x, y" width="150" height="150" onclick="Debug.debug('click: x=%d, y=%d', getMouse('x'), getMouse('y'))"/>
</canvas>
<!-- * X_LZ_COPYRIGHT_BEGIN ***************************************************
* Copyright 2008 Laszlo Systems, Inc.  All Rights Reserved.                   *
* Use is subject to license terms.                                            *
* X_LZ_COPYRIGHT_END ****************************************************** -->
Debug.write() is the simplest way to log to the debugger, but it's
often a better strategy to use Debug.format() or one of its variants
(Debug.debug(), Debug.info(),
Debug.warn(), and Debug.error(). These methods give
you more control over the format of the output. See the reference pages for Debug and lz.formatter for a complete description and
examples. In addition, you can control which messages are logged to the debugger using Debug.messageLevel.
Some object are inspectable. See Section 3.2, “Inspecting Objects” for more about the inspect feature of the debugger. See
Section 3.6, “Customizing Debug.write()
” to see how to customize the display of objects
within the debugger.
If you encounter a bug that prints a message in the debugger and you believe it is an OpenLaszlo bug, take the following steps to generate a bug report:
-
Enable Backtrace in the Developer Toolbar
-
Provoke the error
-
Click on the debugger message to inspect it
-
Invoke
Debug.bugReport()in the debugger -
Copy and Paste the output into your bug report
The Bug Report gives details of the exact build of OpenLaszlo that you are reporting on, the detailed error message, backtrace, and the details of all objects involved.
The debugger has capabilities for formatting output according to control strings.
Debug.formatToString produces formatted output to a string, formatting
its arguments according to the control string:
-
The standard
printfconversions are accepted, with the exception ofa,n, andp. -
e,f, andgconversions are accepted but equivalent tof. -
The
handllength modifiers are accepted but ignored. No errors are signalled for invalid format controls or insufficient arguments.
There is an additional format specifier w that formats the argument
as if by Debug.__String with the 'pretty' option and creates a
'hotlink' so the object can be inspected. If alternate format is requested (#),
w uses the full Debug.__String format used by
Debug.write. w format obeys
Debug.printLength, binding it to the maximum width, if specified in
the control string.
When the debugger prints a string and Debug.printPretty is false,
it will escape all the SingleEscapeCharacter's in the string (that is,
' " \ b \f \n \r \t \v). For example:
Debug.format('%#w', 'This is a "test"\nS\bring') ->«string#6| "This is a \"test\"\nS\bring"» The %d, %u, %i,
%o, and %x directives (and their capital
variants) cast their arguments to the type Number before formatting them. The
%s directive casts its argument to a String. There is no default
precision for these format directives — they will print the fractional part of
non-integers by default. If you require that they round to the nearest integer, you can
use %.0d. If passed an argument that cannot be coerced to a Number,
these format directives print NaN (Not a Number).
Warnings and Errors are inspectable. If you click on
them, you will inspect the warning or error object. If backtracing is enabled, a backtrace
will be one of the properties of the object that you can inspect. Inspecting the backtrace
will reveal the recorded stack frames which record: the function called,
this and the arguments to the function.
In the following example, when you click on the button, it causes a Debug message to be printed.
Clicking on the debug message will inspect that, and reveal the backtrace associated with the message.
|
Note |
|---|---|
|
The |
If you click on one of the entries in the backtrace, you will see that it is a
StackFrame, and will tell you the function that is called, the
arguments, and the value of this in that call. Each of those in turn
can be clicked on to inspect more deeply.
Example 51.6. Backtrace example
<canvas compileroptions="debug: true; backtrace: true" width="100%" height="300">
  <debug x="80" height="90%"/>
  <button name="test" width="75" height="75">
    <handler name="onclick"> Debug.debug("Now click on this message, and then click on the backtrace value you see"); </handler>
    Click Me!
  </button>
</canvas>
<!-- * X_LZ_COPYRIGHT_BEGIN ***************************************************
* Copyright 2007, 2009 Laszlo Systems, Inc.  All Rights Reserved.             *
* Use is subject to license terms.                                            *
* X_LZ_COPYRIGHT_END ****************************************************** -->
Debug.write() displays the printable
representation of an object. Where possible, the representation of an object is
what you would type to represent that object in a program. This is the case for instances of
Singleton types (types with only a single instance, for example,
Undefined and Null) and for instances of
Atomic types (types whose members have only a single value, no
properties; for example, Boolean or Number). Instances
of String are normally not presented in this fashion (that is, they are
not quoted), as usually they are either a message or formatting. Instances of
compound types (types with properties, for example,
Array and Object and Strings that
are longer than Debug.printLength are printed in
inspectable format:
«type(length)#id|name»
where:
-
typeis the type of the object, as computed byDebug.__typeof(). You can customize this field by defining aString-valued property_dbg_typenameor a method yielding aStringof the same name on your class -
lengthis the length of the object, if it is of a type that has a length, such asArrayorString -
idis a unique identifier that can be used to visually distinguish objects whose printed representation may be the same but which are not in fact the same object -
nameis a descriptive name of the object, as computed byDebug.__String(). You can customize this field by defining aString-valued property_dbg_nameor a method yielding aStringof the same name on your class
By default an object is described by its properties, a function by its name (if available).
In addition to Debug.write(), Debug.warn(),
Debug.info(), Debug.format(), there are utilities
for determining client environment (Debug.versionInfo() and others)
-
lz.canvas.versionInfoString()Debug.versionInfo()which can be very helpful to record for bug reports. -
Debug.debug(),Debug.info()— likeDebug.warn()andDebug.error(), but with different colors and tags that match many popular Ajax runtimes. -
Debug.[write,format,debug,info,warn,error]all "Do What I Mean" for format string
Descriptions and Strings are abbreviated to the first
Debug.printLength characters. This property defaults to
1024. You can see all the properties of an abbreviated object, or all of
a string by inspecting it (but take care to check the length of the object — it may take a
very long time to print if it is large).
When the debugger prints an object, if the type part of the description is enclosed in
?'s, it means that the object is potentially corrupted. (Technically it means that
object instanceof object.[[prototype]].constructor is not true.)
Debug messages are enabled/disabled by the setting of
Debug.messageLevel. The valid levels are one of the keys of
Debug.messageLevels. All messages of a lower level than the current
setting will be suppressed.
Example 51.7. Setting the debug message level
<canvas width="100%" height="200" debug="true">
  <script>
    //one of: "ALL", "DEBUG", "INFO", "WARNING", "ERROR", "NONE"
    Debug.messageLevel = "WARNING";

    Debug.write("write");
    Debug.debug("debug");
    Debug.info("info");
    Debug.warn("warn");
    Debug.error("error");
  </script>
</canvas>
<!-- * X_LZ_COPYRIGHT_BEGIN ***************************************************
* Copyright 2008 Laszlo Systems, Inc.  All Rights Reserved.                   *
* Use is subject to license terms.                                            *
* X_LZ_COPYRIGHT_END ****************************************************** -->
Explain the style bindings of properties on a node For each attribute of the node that
has a $style binding, the CSS rules that apply to the node that could
affect that binding are displayed. The rules are displayed (with their source) from the
most-specific to the least specific, and the style names and values of the rule that apply
to this node are displayed. Values that are superseded by more specific rules are displayed
in italics.
The following example demonstrates the use of
Debug.explainStyleBindings(). Click on the color buttons to toggle the
colors; click on the color swatches to see the CSS description.
Example 51.8. Dynamic CSS
<canvas width="100%" height="500" debug="true">
  <debug x="30%" width="65%" y="5%" height="90%"/>
  <stylesheet>
    /* default, should only be seen if things are broken */
    colorswatch { background-color: orange }

    /* Static for buttons */
    colorbutton[color=red] {background-color: red }
    /* `lime` is the HTML name for rgb(0,255,0) */
    colorbutton[color=green] {background-color: lime }
    colorbutton[color=blue] {background-color: blue }

    /* dynamic single selectors that apply to individual swatches */
    [red=off] colorswatch { background-color: cyan; opacity: 0.2 }
    [red=on] colorswatch { background-color: red; opacity: 0.95 }
    [green=off] colorswatch { background-color: magenta; opacity: 0.2 }
    [green=on] colorswatch { background-color: lime; opacity: 0.95 }
    [blue=off] colorswatch { background-color: yellow; opacity: 0.2 }
    [blue=on] colorswatch { background-color: blue; opacity: 0.95 }

    /* dynamic compound selectors that apply to mixer colorswatch */
    [red=off] [green=off] [blue=off] [name=mixer] colorswatch { background-color: black; opacity: 1 }
    [red=off] [green=off] [blue=on] [name=mixer] colorswatch { background-color: blue; opacity: 1 }
    [red=off] [green=on] [blue=off] [name=mixer] colorswatch { background-color: lime; opacity: 1 }
    [red=off] [green=on] [blue=on] [name=mixer] colorswatch { background-color: cyan; opacity: 1 }
    [red=on] [green=off] [blue=off] [name=mixer] colorswatch { background-color: red; opacity: 1 }
    [red=on] [green=off] [blue=on] [name=mixer] colorswatch { background-color: magenta; opacity: 1 }
    [red=on] [green=on] [blue=off] [name=mixer] colorswatch { background-color: yellow; opacity: 1 }
    [red=on] [green=on] [blue=on] [name=mixer] colorswatch { background-color: white; opacity: 1 }
  </stylesheet>

 <!-- button to toggle an attribute which should trigger style change -->
  <class name="colorbutton" width="40" height="20" align="center">
    <attribute name="bgcolor" style="background-color"/>
    <attribute name="color" type="string"/>
    <text fgcolor="white" text="${this.parent.on}" align="center"/>
    <attribute name="on" type="string" value="off"/>
    <handler name="onclick">
      this.setAttribute('on', this.on === 'on' ? 'off' : 'on' );
    </handler>
  </class>

  <!-- color swatch that is styled by background-color and opacity -->
  <class name="colorswatch" height="60" width="60" bgcolor="gray" align="center">
    <attribute name="swatchcolor" style="background-color" type="color"/>
    <attribute name="swatchopacity" style="opacity" value="1"/>
    <handler name="onclick">
      Debug.clear();
      Debug.explainStyleBindings(this);
    </handler>
    <view name="swatch" x="5" y="5" height="50" width="50">
      <attribute name="bgcolor" value="${parent.swatchcolor}"/>
      <attribute name="opacity" value="${parent.swatchopacity}"/>
    </view>
  </class>

  <!-- nested views with red, green, blue attributes that dynamically change
       to demonstrate the applicability of compound dynamic selectors  -->
  <view x="5%" y="5%" width="20%" height="80%" layout="axis: y; spacing: 5">
    <text width="100%" multiline="true">
      Toggle the red, green, and blue buttons on and off to
      dynamically update the applicable CSS selectors.  Click on a color
      swatch to explain the applicability of the CSS selectors.
    </text>
    <attribute name="red" value="${this.toggle.on}" type="string"/>
    <colorbutton name="toggle" color="red"/>
    <colorswatch/>
    <view width="100%" layout="axis: y; spacing: 5">
      <attribute name="green" value="${this.toggle.on}" type="string"/>
      <colorbutton name="toggle" color="green"/>
      <colorswatch/>
      <view width="100%" layout="axis: y; spacing: 5">
        <attribute name="blue" value="${this.toggle.on}" type="string"/>
        <colorbutton name="toggle" color="blue"/>
        <colorswatch/>
        <view width="100%" name="mixer" layout="axis: y; spacing: 5">
          <text align="center">Mixer</text>
          <colorswatch id="mixer"/>
        </view>
      </view>
    </view>
  </view>
</canvas>
<!-- * X_LZ_COPYRIGHT_BEGIN ***************************************************
  * Copyright 2010 Laszlo Systems, Inc.  All Rights Reserved.                   *
  * Use is subject to license terms.                                            *
  * X_LZ_COPYRIGHT_END ****************************************************** -->
Sometimes you may have computations that you need to make only when you're debugging an application. For example, you may include some time stamps in order to measure performance of certain sections of code.
The best practice here is to enclose any debug-only computations in
        if ($debug) {
        ...
        }
The compiler will omit those statements when you compile without debugging.
|
Note |
|---|---|
|
This section is unlikely to be of use to LZX users, but it can be helpful for LZX developers. |
Messages can be written from an LZX application to the server log
through the use of the logdebug=true query parameter and the
Debug.log() method.
If you set logdebug to true, then any
output to the debugger will be logged. This can be helpful if you find the system crashing
before the debugger is started. We recommend using the Debugger Console first and only
resort to logging if even the Debugger Console is not working. (For the DHTML runtimes, if
there is a runtime console object with a log method,
logging will be automatically turned on. This is the case for Safari if the Developer
feature is enabled, or Firefox if the Firebug plug-in is installed.)
Where does logging information go? In the case of the SWF8 runtime, the information is
logged back to the LZX server and can be seen by inspecting the server log. For the DHTML
runtime, if the browser supports a console (for example, developer
versions of Firefox, Safari), the information will be logged to the browser console. For the
SWF9 runtime, if the application is being run under the Flex debugger,
fdb, the information will be logged to the debugger.
The Debug.log() method can be used to log directly to the server,
independent of the setting of logdebug, but this is hardly ever
necessary. It takes a single argument; if the argument is the result of
Debug.formatToString, some runtimes (for example, DHTML on Firefox)
will "present" the formatted string in a way that will allow you to inspect the objects
represented by the string, but this is not supported for all runtimes.
See the OpenLaszlo System Administrator's Guide for information about configuration and reading the server log.
A running OpenLaszlo application allocates parts of available virtual memory to store objects. When these objects are no longer needed the memory should be released by the application in order to become once again available for other use. Sometimes unneeded memory is not properly released, in which case the application tends to slow down over time as less and less memory becomes available. This is "leaking memory." The OpenLaszlo debugger can help you find memory leaks.
Three methods on Debug are used to find leaks:
-
markObjects() -
findNewObjects() -
whyAlive()
You use them in that order. Typically, you will start up your program, run it for a bit
until you think it has reached a steady state. Then invoke
Debug.markObjects(). This runs in the background and will mark all the
objects that are currently in use. When you see the output Trace Done you
can move on to the next step.
     lzx> Debug.markObjects()
     WARNING: Memory tracing is for experimental use only in this runtime.
     Marking objects …
     lzx> DEBUG: 1 loops @ 7590 iterations, 1194.00 milliseconds
     … done!
You exercise your application in a way that you expect not to result in any retained storage (or some small amount of retained storage).
    lzx> canvas.thisIsALeak = {some: 'new', data: 42}
    «Object#136| {data: 42, some: 'new'}»
Run Debug.findNewObjects(). This also runs in the background and will find
any new objects that have been allocated since the markObjects() call that have
not yet been garbage-collected. When you see the output done! you can move on to
the next step.
    lzx> Debug.findNewObjects()
    WARNING: Memory tracing is for experimental use only in this runtime.
    Finding new objects …
    lzx> DEBUG: 2 loops @ 3797 iterations, 674.50 milliseconds
    … done!
Call Debug.whyAlive(). This returns a leak list.
    lzx> Debug.whyAlive()
    WARNING: Memory tracing is for experimental use only in this runtime.
    18 smoots [1 objects @ ~18 smoots each]:
    global.canvas.thisIsALeak: (£18) «Object#136| {…, data: 42, some: 'new'}»
    «__LzLeaks(2)#140| 18 smoots [1 objects @ ~18 smoots each]»
    lzx>
showing <why>: (<size>): <what> pairs. <why> is the shortest path from global that is keeping the object from being collected; <size> is an approximation (in Smoots) of the size of the object and its descendants, which is a rough indication of the cost of the object; <what> is the debugger representation of the object. You can also inspect the leak list items to see the objects that have been retained.
![[Warning]](../includes/warning.gif)
![[DHTML]](../includes/dhtml.gif)
DHTML only: The features described in this section only work in applications compiled to DHTML. They do not work in applications compiled to other runtimes.
For debugging the DHTML runtime, we recommend the Firebug extension to Firefox. If Firebug reports an error (with a little tiny red X in the bottom right hand corner of your Firefox window) then there is probably a bug in your code or an OpenLaszlo bug. The errors reported by Firebug can be very obscure, but they usually happen when you are dereferencing a null pointer.
Firebug is more useful if you compile your DHTML application under debug mode
(debug=true) so that method names show up in firebug stack traces.
Dropping down the arrow next to an exception in firebug will show a complete stack trace -
often helpful for tracking down the root cause. Please file bugs with a stack trace if
possible!
When you're compiling to DHTML, you generally use a two-step/two debugger process. It is always a good practice for you to have Firebug, because the OpenLaszlo debugger does not catch _all_ errors (it would be too much overhead to do so). We try to make our code debuggable in Firebug, as much as possible, but there are several limitations:
-
Firebug does not know about our class system, so it cannot display our objects as intelligently as our debugger, and
-
Firebug does not understand OpenLaszlo #file and #line declarations, so it cannot give as accurate error locations as our debugger does.
|
Note |
|---|---|
|
If you have Firebug enabled in Firefox, the LZX debugger echos all messages to the
Firebug console, preserving objects. The Firebug debugger will attempt to interpret an
object with a |
If you are using Safari to debug DHTML, we recommend that you enable
Preferences/Advanced/Show Develop menu in menu bar and from that menu
Develop/Show Error Console. This will enable Safari's console, and as
with Firebug, you will be able to catch errors not caught by the LZX debugger.
The Flash runtime is permissive about dereferencing a null reference and getting properties on an undefined object. DHTML blows up if you do this. By "blows up" we mean that each DHTML browser crashes or hangs in a different way when the application code dereferences a null pointer. Lots of legacy code doesn't check for null.
In JavaScript you are allowed to ask for a non-existent slot, but not for a slot on
something that is not an object. Therefore, don't say foo.bar unless you
know that foo is an object. If you know foo is either an object or null, you can say
if (foo) before you say foo.bar. If you don't even
know that, you would need to say if (foo is Object).
Furthermore, in DHTML you cannot reference a non-existent variable.
Therefore you should declare all your variables. In SWF, you could get by without declaring
them, and they would just appear to be undefined, in DHTML, you will get
a has no properties error if you refer to foo and you
have not first said var foo.